Amy Savagian MD
  • Home
  • Research & Posts
  • Contact US
  • New & Current Patients
  • Supplements

 Posts

My hope with these posts is to empower others.  I  want to share my interests: those things that enthrall me and I think will interest you.  The posts are not meant to give medical advice, but is meant simply to share the information related to health, wellness and longevity that I find fascinating right now. The first four posts starting October 2019 are the foundation for my lifestyle medicine practice.
Click the button to subscribe to email updates.

I want email updates

Fitness, VO2 max, Peak METs and Longevity

1/18/2023

 
We intuitively know that “fitness” is good for us, but “fitness” is a vague definition. In this post I will discuss how we can measure fitness quantitatively and what fitness levels confer healthspan and mortality benefits. 

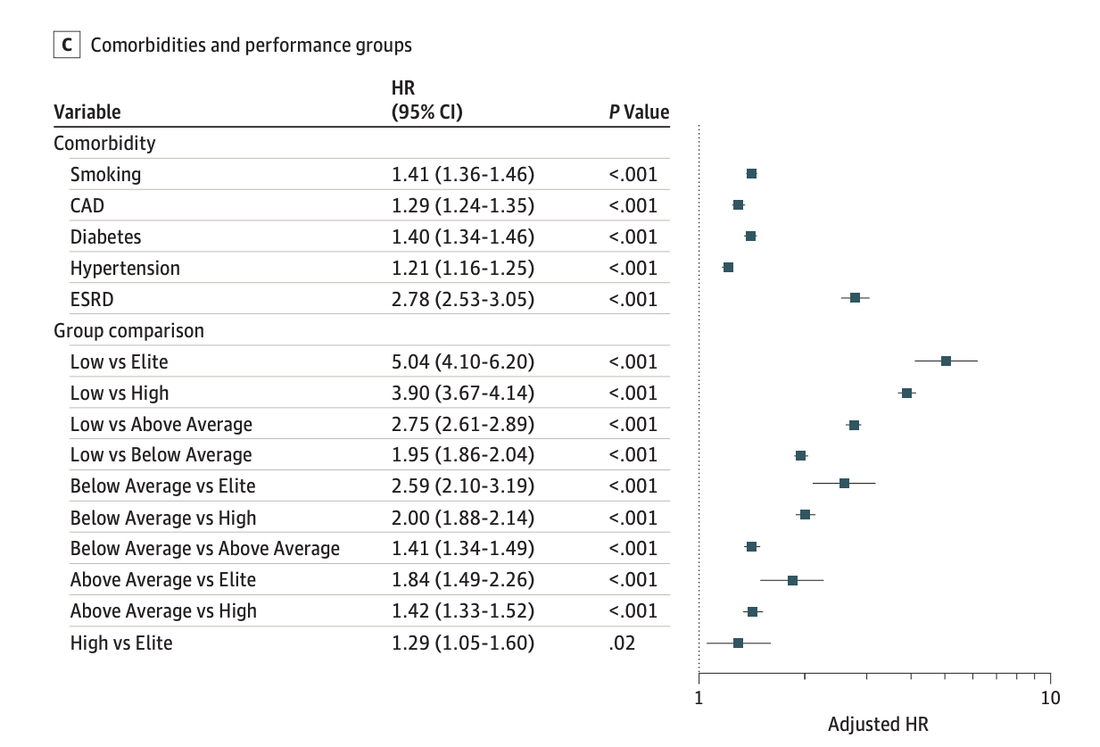
In an article published in JAMA, (Journal of the American Medical Association) the Cleveland Clinic analyzed 23 years of patient data from 1991-2014 (122,007 patients) and evaluated the association of all-cause mortality (death for any reason) and cardiorespiratory fitness. They also evaluated age, gender, race/ ethnicity, and co-morbidities such as diabetes, hypertension, smoking and coronary artery disease (CAD).

The findings were remarkable. Their findings on typical risk factors were consistent with what we often see. Having diabetes, coronary artery disease (CAD), smoking, or hypertension conferred approximately a 1.2-1.4X mortality risk or an approximately 20-40% increase risk of death from any cause, but here is the remarkable aspect, being out of shape or having low fitness conferred a 5x mortality risk, in other words a 400% increase risk of death from any cause over any time period. In other words being out of shape was 3 to 4 times worse than smoking, having diabetes or having CAD.  ​
Picture
Photo cred:​https://jamanetwork.com/journals/jamanetworkopen/fullarticle/2707428
Other groups have published similar findings.  In a circulation article published in 2014, Blair et al found that for every 1-MET (Metabolic equivalent) increase in exercise capacity, mortality risk was 12% lower. A study performed by the National Cancer institute evaluated 654,827 individuals and found up to a 4.5 year gain of lifespan with increasing activity. 

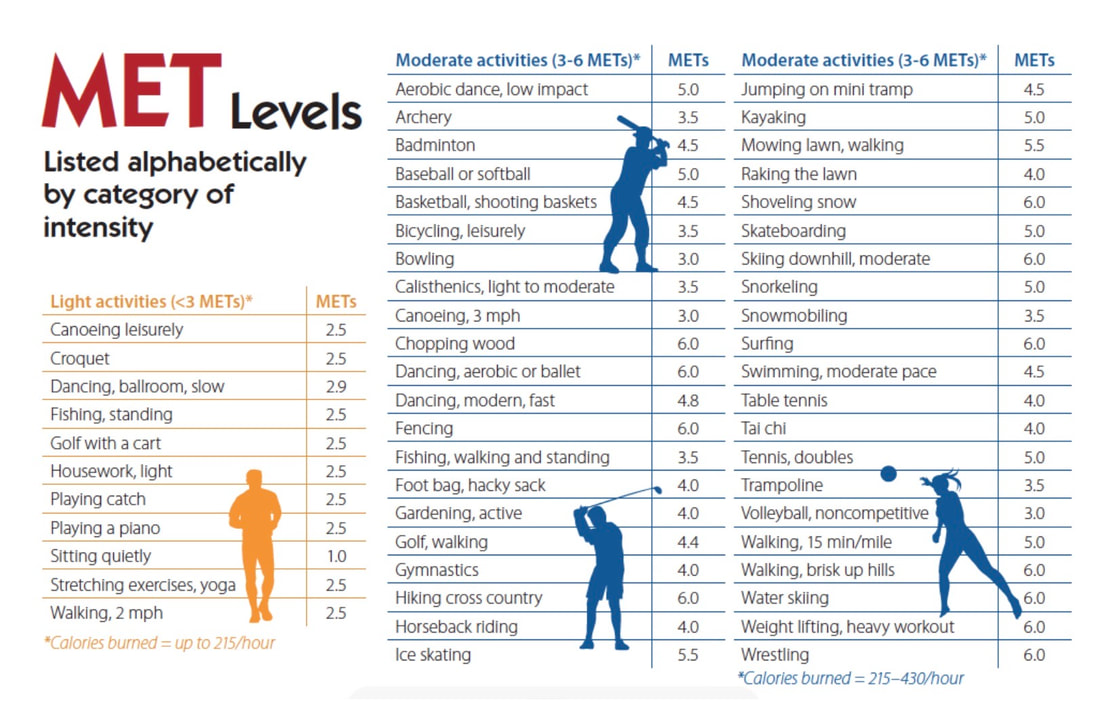
There are a few ways to quantitatively measure fitness.  In the Cleveland Clinic study mentioned above they used METs as they had Exercise Treadmill Tests that evaluated peak METs. For those who have never heard of METs or peak METs. A MET is the amount of energy used during any activity. One MET is defined as the amount of oxygen consumed while sitting at rest and is equal to 3.5 ml oxygen per kg body weight x minutes of activity. For reference,  walking (3.5–4 mph) is generally around 5 METs. Singles tennis is approximately 8 METs and running a 10 minute mile is approximately 10 METs. As the intensity increases the number of METs increases. Testing a person’s peak METs is one way to establish fitness. Below is a chart of activity and expect METs.
Picture
Photo cred: ​https://oss.adm.ntu.edu.sg/xloh002/activity-range/

Another way to evaluate fitness is the measure the volume of oxygen the body can use, measured in milliliters per kilogram per minute. This measurement is called VO2 max and it is the gold standard for measuring aerobic fitness. Vo2max depends on cardiac output (the pumping ability of the heart stroke volume x heart rate), air exchange in the lungs, blood flow to the muscles and atmospheric oxygen available (due to elevation). Vo2 max is measured by an exercise physiologist as the patient or athlete runs or bikes at progressively harder levels while wearing a mask connected to a machine that evaluates exhaled oxygen and carbon dioxide. Using VO2max we can evaluate relative endurance. 

To me the data on fitness argues that fitness testing, ideally a VO2max test should be a part of every person's preventative health plan. We need to understand where we are in order to implement a targeted plan to achieve our health goals.

References:
​

Ruegsegger GN, Booth FW. Health Benefits of Exercise. Cold Spring Harb Perspect Med. 2018 Jul 2;8(7):a029694. doi: 10.1101/cshperspect.a029694. PMID: 28507196; PMCID: PMC6027933.
https://www.ncbi.nlm.nih.gov/pmc/articles/PMC6027933/ 

​
Mandsager K, Harb S, Cremer P, Phelan D, Nissen SE, Jaber W. Association of Cardiorespiratory Fitness With Long-term Mortality Among Adults Undergoing Exercise Treadmill Testing. JAMA Netw Open. 2018;1(6):e183605. doi:10.1001/jamanetworkopen.2018.3605
https://jamanetwork.com/journals/jamanetworkopen/fullarticle/2707428

​Blair SN, Kohl HW, Paffenbarger RS, Clark DG, Cooper KH, Gibbons LW. Physical Fitness and All-Cause Mortality: A Prospective Study of Healthy Men and Women. JAMA. 1989;262(17):2395–2401. doi:10.1001/jama.1989.03430170057028
https://jamanetwork.com/journals/jama/article-abstract/379243

​Meyers J, Prakash M, Froelicher V et al. Exercise Capacity and Mortality among Men Referred for Exercise Testing. N Engl J Med 2002; 346:793-801. DOI: 10.1056/NEJMoa011858 https://www.nejm.org/doi/full/10.1056/NEJMoa011858

Blair S et al. Age-Specific Exercise Capacity Threshold for Mortality Risk Assessment in Male Veterans. Circulation 2014;130:653–658. 
https://www.ahajournals.org/doi/full/10.1161/circulationaha.114.009666

https://med.virginia.edu/exercise-physiology-core-laboratory/fitness-assessment-for-community-members/vo2-max-testing/
​

Moore S et al. Leisure Time Physical Activity of Moderate to Vigorous Intensity and Mortality: A Large Pooled Cohort Analysis. PLOS Medicine. November 6, 2012 https://doi.org/10.1371/journal.pmed.1001335
https://journals.plos.org/plosmedicine/article?id=10.1371/journal.pmed.1001335


Why Get Body Composition DXA Scans? The Basics.

1/13/2023

 
Picture
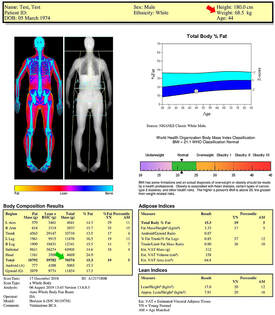
DXA stands for Dual X-ray Absorptiometry. DXA scans help us understand body composition, and I believe a DXA scan can be an important part of a lifestyle plan. It can help us determine the appropriate nutritional and resistance training plan. There are three basic items the DXA evaluates: bone density, fat and lean mass. I am going to discuss all three aspects below:
(As an aside t
here is radiation exposure, however it is very minimal at 1-4 uSv. By comparison, a chest X-Ray (20 uSv) that has about 5-20x more radiation and a CT 10,000x more radiation. )


Bone Density:
Bone density is an important metric as it helps us to understand risk of fractures. Fractures particularly hip fractures have a high morbidity and mortality. According to the CDC there are approximately 300,000 hip fractures per year in those 65 years and older [CDC]. Given that there are approximately 56 M Americans who are 65 years or older this gives a crude approximation of 1 hip fracture per every 187 Americans over the age of 65. Of these, studies have found that approximately 25-50% will die over the next year depending on the study. [Cui et al, Schnell et al]  This is a staggering number for something that is preventable. For those of us under 65, we should be doing all we can to prevent bone loss. A DXA reports your score for hip, femoral neck and lumbar spine as a T and Z scores. The z-score compares your bone density to others your age. The T-score is the number we care about and it compares your bone density to that of a 30-year-old. A T score of -1.0 or higher is considered normal bone density. A score of -1.0 and -2.5 is in the osteopenia range, and anything under -2.5 is considered the osteoporosis range.

Below, you can see a sample report.  While osteopenia and osteoporosis are always defined by the T score of -1 and -2.5 at every age, the downtrending lines represent bone density by age (the average and +/-1 standard deviation), in essence showing the expected bone loss by year.
​
Picture
Graphs derived from NHANES & GE Lunar databases.
Fat:
Fat is reported through several metrics.  It is reported as Body Fat%, Fat Mass Index, Visceral Adipose Tissue (VAT) and Android to Gynoid ratio. Let me define each of these for you. 
Your Body Fat % is the % of your body weight that is fat.  
The Fat Mass Index  is your total body fat (in kilograms) / your height (in meters squared). 
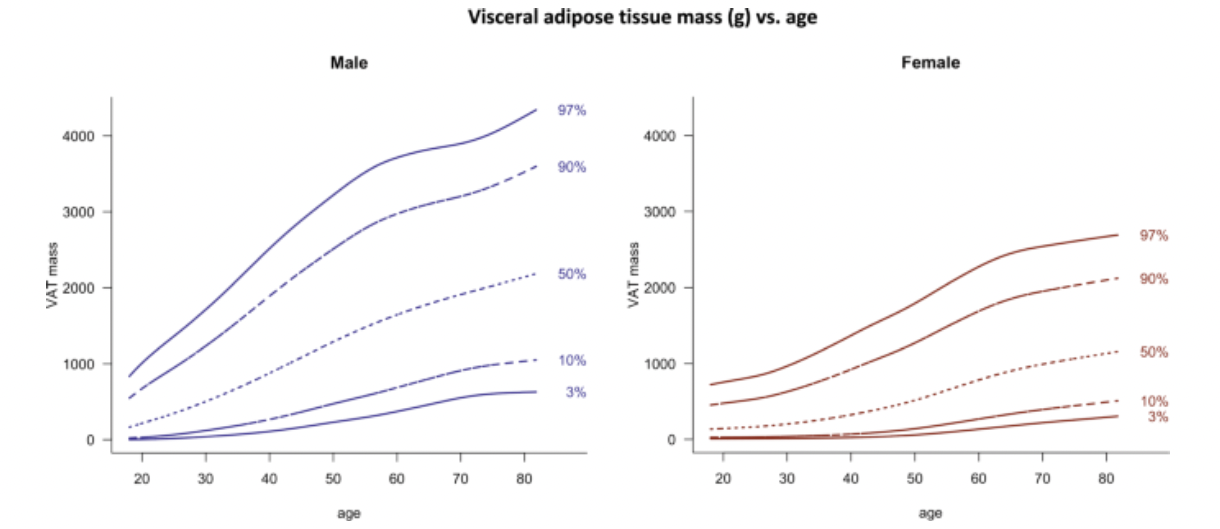
Visceral Adipose Tissue (VAT) is the amount of fat around your organs. This is the hormonally active fat that plays a role in insulin resistance and inflammation. It has a high correlation to metabolic and cardiovascular disease. 
The android to gynoid ratio is the ratio of fat around the belly (android) to the fat around the hips (gynoid). Ideal android/ gynoid ratios are <0.8 for women and <1.0 for men.
Of all of these fat ratios, the VAT is the most interesting to me, as subcutaneous fat does not seem to have as much metabolic consequence as VAT.

When looking at VAT, it is helpful to consider it in terms of age and population percentiles as illustrated in the charts below.

Picture
Graphs from LEAD cohort published in Nature
Lean Mass:
Lean mass is everything that is not fat.  This includes muscle, bone, water, connective tissue, skin and organs. The metrics I find important associated with lean mass include: Fat Free Mass Index (FFMI), Appendicular Lean Mass / Height Ratio (ALM/Height2) and Appendicular Lean Mass to BMI. (ALM/BMI).  
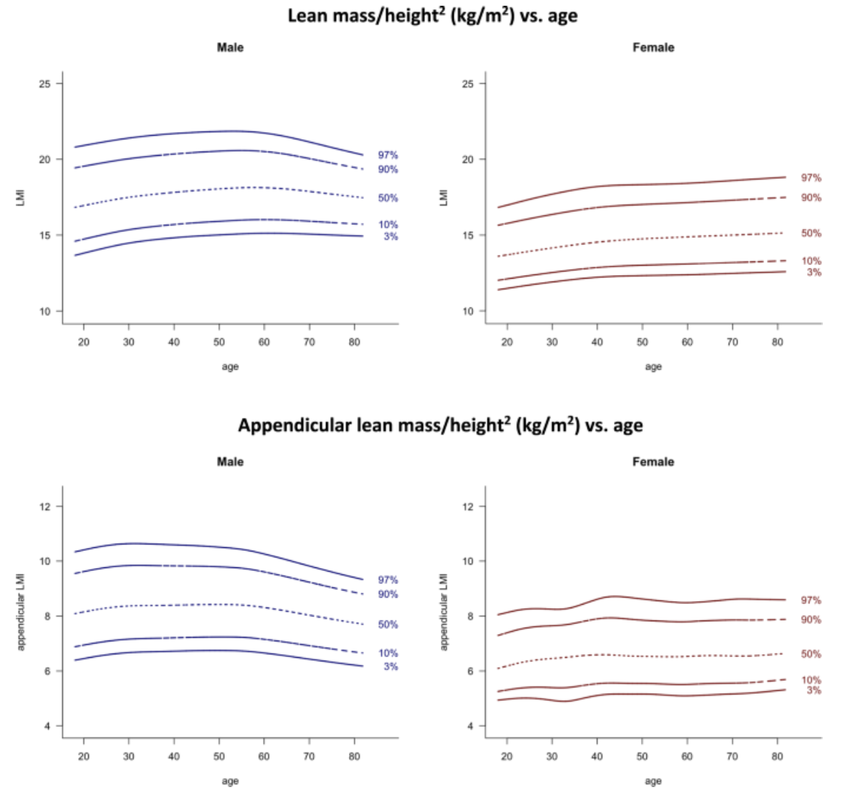
FFMI is the amount of lean mass in kilograms divided by height in meters squared. This can be used to help understand if you are under-muscled relative to others in your age group.
Appendicular Lean Mass / Height Ratio (ALMI) is the amount of lean mass in your arms and legs divided by your height2. Low ALM/Ht2 is an important risk factor for low body muscle or sarcopenia.  ALMI <5.5 for women and <7 for men are considered to be at risk of sarcopenia, however age based distributions 
Appendicular Lean Mass/ BMI ratio (ALM/ BMI) is the ratio of lean mass relative to BMI. Sarcopenia for ALM/BMI is considered to start at <0.51 for women and <0.79 for men. ALM/BMI is the most important ratio in my perspective as it considers muscle mass relative to those with a similar weight to height ratios.

Lean mass ratios are important in understanding muscle mass.  We know that low muscle mass is associated with cognitive decline [Tessier] low bone density [Oubdier, Taniguchi] and those with lower muscle mass appear to die earlier [Bachettini, Srikanthan].  Understanding your muscle mass will help us understand how aggressive you should be with resistance training.

When evaluating FFMI and ALMI it is again helpful to consider them in relation to age and distribution.
Picture
Graphs from LEAD cohort published in Nature

To Summarize DXA scans are helpful in understanding if your fat is metabolically concerning, if you need to gain muscle and how your bone density is faring. I tried to illustrate why it is important to understand each of these factors.

If you schedule a dexa try to always schedule with the same machine, avoid calcium supplements for 24 hours before the scan and avoid food for 3 hours before the scan. Hydration can play a role with more water giving higher lean mass reading.

DXAs are important because they allow us to benchmark and determine if we need to address muscle mass, VAT or bone density. It allows us to being thinking about nutritional goals and resistance training.

I hope this was a helpful,

Amy

​
References:

​
Bachettini, N.P., Bielemann, R.M., Barbosa-Silva, T.G. et al. Sarcopenia as a mortality predictor in community-dwelling older adults: a comparison of the diagnostic criteria of the European Working Group on Sarcopenia in Older People. Eur J Clin Nutr 74, 573–580 (2020). https://doi.org/10.1038/s41430-019-0508-8

CDC.gov, Hip Fracture Risks, Retrieved 1/3/23 
https://www.cdc.gov/falls/hip-fractures.html#:~:text=Each%20year%20over%20300%2C000%20older,are%20hospitalized%20for%20hip%20fractures.&text=More%20than%2095%25%20of%20hip,2%20usually%20by%20falling%20sideways.&text=Women%20experience%20three%2Dquarters%20of%20all%20hip%20fractures.

​Cui, Z., Feng, H., Meng, X. et al. Age-specific 1-year mortality rates after hip fracture based on the populations in mainland China between the years 2000 and 2018: a systematic analysis. Arch Osteoporos 14, 55 (2019). https://doi.org/10.1007/s11657-019-0604-3

Oudbier S, Goh J Looijaard S, Reijnierse E, Meskers C, Maier A, Pathophysiological Mechanisms Explaining the Association Between Low Skeletal Muscle Mass and Cognitive Function, The Journals of Gerontology: Series A, Volume 77, Issue 10, October 2022, Pages 1959–1968, https://doi.org/10.1093/gerona/glac121

​
Schnell S, Friedman SM, Mendelson DA, Bingham KW, Kates SL. The 1-year mortality of patients treated in a hip fracture program for elders. Geriatr Orthop Surg Rehabil. 2010 Sep;1(1):6-14. doi: 10.1177/2151458510378105. PMID: 23569656; PMCID: PMC3597289.

Srikanthan P, Karlamangla AS. Muscle mass index as a predictor of longevity in older adults. Am J Med. 2014 Jun;127(6):547-53. doi: 10.1016/j.amjmed.2014.02.007. Epub 2014 Feb 18. PMID: 24561114; PMCID: PMC4035379.

Taniguchi Y, Makizako H, Kiyama R, Tomioka K, Nakai Y, Kubozono T, Takenaka T, Ohishi M. The Association between Osteoporosis and Grip Strength and Skeletal Muscle Mass in Community-Dwelling Older Women. Int J Environ Res Public Health. 2019 Apr 6;16(7):1228. doi: 10.3390/ijerph16071228. PMID: 30959864; PMCID: PMC6480005

Tessier et al. Association of Low Muscle Mass with Cognitive Function During a 3 Year Follow up Among Adults Aged 65 to 86 Years in the Canadian Longitudinal Study on Aging. JAMA Network Open 2022;5(7):e221996. doi:10.1001/jamanetworkopen.2022.19926

.​​

    Author

    Amy Savagian, MD

    Archives

    February 2023
    January 2023
    October 2022
    January 2021
    May 2020
    April 2020
    March 2020
    January 2020
    December 2019
    November 2019
    October 2019

    Categories

    All
    7 Minute Workout
    ALMI
    Blue Zones
    Body Composition
    Bone Density
    CD-38
    DXA
    Exercise
    Fasting
    Healthspan
    HIIT
    Lifestyle
    Longevity
    Meditation
    Mindfulness
    Nad
    Parasympathetic Nervous System
    SARS CoV 2
    SARS-CoV-2
    Senescent Cells
    Sleep
    Telomere
    Time Restricted Eating
    VAT
    Zombie Cells

    RSS Feed

Concierge Services

Performance & Longevity Medicine
​Hormone Optimization
​Nutritional Coaching with Stacy

Support


Contact Us ​
Credit Card Payments


© COPYRIGHT 2016. ALL RIGHTS RESERVED.
  • Home
  • Research & Posts
  • Contact US
  • New & Current Patients
  • Supplements